

Abstract
Point defects in freestanding graphene monolayers such as monovacancies (MVs) and divacancies have been investigated at atomic scale with aberration-corrected transmission electron microscopy and theoretical calculations. In general, these defects can be formed simply by the absence of individual carbon atoms and carbon bond reconstructions in the graphene lattice under electron and ion irradiation. However, in this study, we found that oxygen and hydrogen atoms can be involved in the formation of these point defects caused by the simultaneous detachment of oxygen–carbon atoms. Here we report the effect of the oxygen and hydrogen atoms on the graphene surface forming the point defects under electron beam irradiation, and their role of stabilizing other MVs when composed of 13–5 ring pairs. In addition, theoretical analysis using density functional theory calculations demonstrates that the participating atoms can form the point defects in the intermediate states and stabilize 13–5 ring pairs under electron beam irradiation.
Export citation and abstract BibTeX RIS
1. Introduction
Interest in point defects in monolayer graphene has been driven by many research areas [1]. Except in the case of intrinsic defect investigation, defect studies were first motivated by a desire to understand the aspects of radiation damage occurring in graphene sheets [2, 3]. The characterization of point defects is also an important research topic because graphene has various defects, e.g. dopants, monovacancies (MVs), and multivacancies [4–13]. These atomic defects can be induced by electron or ion irradiations [14–17] and be also observed in graphene/hexagonal boron nitride heterostructures [18]. Furthermore, the formation of defects reflects the behavior of carbon atoms in the graphene sheet, including defect structure and energy [19]. For example, vacancies [1, 5, 19–25] are formed as a result of knock-on displacements of carbon atoms, which can be well explained by various calculations and experimental results [6, 8, 13, 26–28]. The study from vacancies to is an essential contribution to the basic understanding of complicated defect formation processes in graphene sheets.
In addition, oxidized graphene surfaces have been studied extensively and have recently been the subject of considerable interest due to their impact on the surface chemistry of graphene [29–39]. Graphene oxide (GO) and reduced GO have large quantities of oxygen-containing functional groups. However, their specific observations are limited in transmission electron microscopy (TEM), since there are few defect-free areas for analyzing the behavior of these groups. Although point defects occurring in oxygen-containing functional groups of graphene sheets have been studied by theoretical studies, the atomic behavior of these oxygen and carbon atoms has not been investigated under electron beam irradiation.
An atomically modified graphene surface with partial surface oxidation can be prepared by many known methods of oxidation [40–44] and dry oxidation treatment such as ultraviolet–ozone (UVO) and oxygen plasma. Such treatment can effectively induce [44] adsorption of oxygen atoms on the graphene lattice [45, 46] on a clean graphene surface for a short time. These functional groups have various behaviors under electron beam irradiation and can cause point defects [7]. In particular, UVO treatment is an appropriate oxidation method for TEM observation because UVO-treated graphene sheets have many oxygen adsorption and clean regions to sufficiently analyze the bonding behavior without topological defects [47].
In this paper, we propose OH molecules are involved in the formation of point defects from MVs to divacancies (DVs) in graphene monolayers. The adsorption of oxygen atoms on the clean graphene surface was induced using UVO treatment without lattice distortions [44]. Point defects were main result of UVO treatment and combined electron beam irradiation. Each point defect had different intermediate states. In particular, when OH molecules on the pristine graphene sheet dissociated into oxygen and hydrogen atoms, and hydrogen atoms became involved in the graphene lattice, a new structure of 13–5 ring pairs appeared. We describe the dynamics of oxygen and hydrogen atoms on graphene surfaced using atomic resolution TEM (ARTEM) imaging with density functional theory (DFT) calculations to interpret the intermediate states of atomic structure and point defect formation.
2. Results and discussion
This section presents results of the three types of point defects mentioned above. The first type is normal MV (figures 1–4). In general, ejection of atom occurs at random locations, and vacancies appear randomly in the area exposed to the electron beam. However, in our experimental conditions, point defects are formed in the graphene lattice to which OH molecules are attached. The MV was the most frequently observed defect in TEM investigations. With the random transfer of kinetic energy from the electrons emitted to carbon atoms during the experiment, it is natural that the stable structures are often found. Therefore, the rich appearance of MV in the experiment is consistent with the fact that MV is the most stable structure among point defects formed by the electron beam irradiation of OH molecules adsorbed on a monolayer graphene lattice.
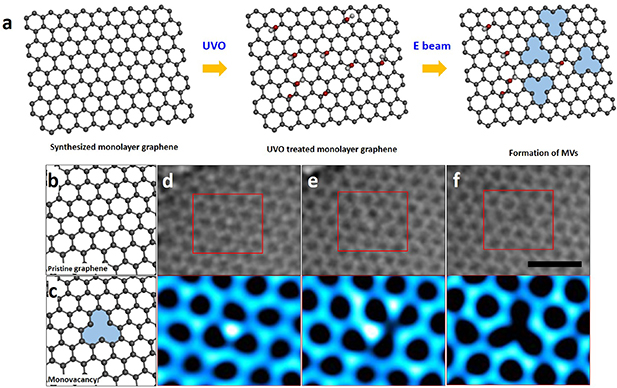
Figure 1. ARTEM images of an MV in the monolayer graphene sheet. (a) Simple schematics showing formations of MVs in an UVO-treated graphene sheet. (b), (c) Atomic models showing a pristine graphene sheet and an MV in the sheet. (d), (e) TEM images showing OH on the sheet and an intermediate state of this process with enlarged images of red boxes in (d) and (e), respectively. (f) ARTEM image showing the formation of the MV with the enlarged image. The enlarged images were colored using ImageJ. The scale bar is 1 nm.
Download figure:
Standard image High-resolution imageAn oxygen atom with a hydrogen atom is preferentially adsorbed to a carbon atom as described in previous related studies [48]. If hydrogen is not considered, it is difficult to confirm the behavior by TEM because the structure that is regarded as a hydroxyl group cannot be stably maintained [49, 50]. Therefore, we considered the role of the hydrogen atom in these processes. Also, in the experiment, several OH molecules may exist at the same time. However, in the TEM observations, only one OH molecule was found, and this OH molecule was thought to have the greatest effect on the formation of vacancy. Therefore, we performed the calculation for the case where only one OH molecule is involved.
Incidentally, we used the UVO-treated monolayer graphene sheet described in the previous study [47] and confirmed that there are only carbon and oxygen atoms using electron energy loss spectroscopy. In particular, we acquired all images of areas where other elements are not detected except carbon and oxygen atoms [47].
2.1. Monovacancy formation from hydroxyl group
As illustrated in 1(a), we used UVO-treated monolayer graphene sheet for 60 s figure [47] and recorded atomic behavior demonstrating the formation of MVs from oxygen atoms attached to a graphene lattice. Pristine graphene sheet is free of defects as shown in figure 1(b) and MV can be formed at any location as shown in figure 1(c). However, from the ARTEM image, the formation of MV at the oxygen atom position on the graphene sheet was observed. Figure 1(d) with the red box enlarged shows atoms attached. The brightly contrasted atoms present a hydroxyl group (OH) adsorbed during the oxidation treatment. The intermediate state is observed under electron beam irradiation as shown in figure 1(e), and then the MV is observed in figure 1(f). This process often occurs during observation, as shown in figure S1 (available online at https://stacks.iop.org/NANO/32/025704/mmedia). Figure 2 shows a DFT calculation that matches well with the experimental image. For the intermediate states (figures 2(b)–(f)), atomic positions were chosen based on the actual TEM images by assigning carbon and oxygen atoms to the bright spots in the images of figure 1(e).
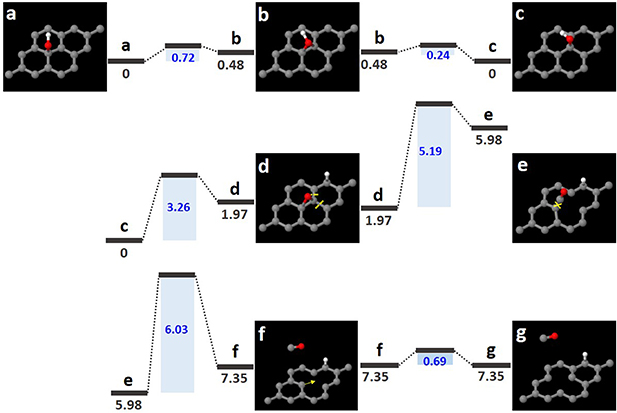
Figure 2. Atomic models of MV formation derived from a hydroxyl group, along with energy barriers and formation energies for this process. (a) Graphene monolayer with a hydroxyl group. (b)–(f) Intermediate states of this process. (g) Final state. Red and white balls represent oxygen and hydrogen atoms, respectively. This process is considered to break the O–H bond while detaching C–O atom from the graphene sheet. The blue values represent energy barriers and the dark gray bars represent the respective formation energies (eV).
Download figure:
Standard image High-resolution imageIn the TEM images of figure 1, we clarify structural changes during the formation of an MV derived from a hydroxyl group. The MV is presented in figure 1(f) with the position of the OH switched with that of the MV. Therefore, while taking three images (figures 1(d)–(f)), the MV appears to have entered an intermediate state. Hence, the atomic structure captured in figure 1(e) should record the intermediate state of this process. However, the atomic structure recorded in figure 1(e) not observed in previous reports is considered an atomic structure of several metastable intermediate states.
We propose a route for the formation of MVs derived from hydroxyl groups. Figure 2(a) shows a hydroxyl group in the same location as in figure 1(a). The OH molecule in the hydroxyl group moves to the bridging C–C bond in the graphene lattice with an energy barrier of 0.72 eV (figure 2(b)). In figure 2(c), the OH molecule travels back to an adjacent carbon atom along the zigzag path. In figure 2(d), the OH molecule dissociates into oxygen and hydrogen atoms with an energy barrier of 3.26 eV, and the hydrogen atom is attached to another neighboring carbon atom. When the evaporation barrier of the C–OH molecule is greater than 10 eV, this dissociation process favors the entire process. The hexagonal lattice containing oxygen and hydrogen atoms is converted to MV by breaking the C–C bonds in the graphene lattice (indicated by the two yellow dashed lines in figure 2(d)) while desorbing the C–O atoms (indicated by the yellow 'X' in figure 2(e)). The energy barrier for breaking the two C–C bonds in figure 2(d) was found to be 5.19 eV, and that for simultaneously detaching the C–O atoms onto carbon atoms in the graphene lattice (indicated by the yellow 'X' in figure 2(e)) was found to be 6.03 eV. Furthermore, the migration barrier of the carbon atoms (indicated by the yellow arrow in figure 2(f)) was found to be 0.69 eV. These energy barriers were too high to overcome with thermal activation at room temperature; therefore, the activation energy for the transition had to be provided by the electron beam of the TEM. After the desorption of the C–O atoms and the displacement of the carbon atom, the MV was finally formed in the graphene sheet (figure 2(g)).
In the absence of hydrogen involved in the MV formation process, when comparing figures S2 and S3, the position of the oxygen atom is changed to the position of the carbon atom next to it. However, based on figure 1, in order to form a MV at the position where only oxygen atom attached to the carbon atom, the oxygen atom must be moved to the position of figure S2(b). Therefore, calculation results indicate the MV formation process is not preferred by only involving oxygen atoms. To continue explaining the route constructed in the next step, the energy barrier to break the C–C bonds in figure S2(b) was found to be 5.19 eV, and the energy barrier to simultaneously detach the C–O atoms from the graphene lattice (indicated by the yellow 'X' in figure S2(c)) was found to be 6.03 eV. Meanwhile, the displacement barrier of the carbon atom (indicated by the yellow arrow in figure S2(d)) was found to be 0.69 eV. After the detachment of the C–O atoms and displacement of the carbon atom, an MV finally formed in the graphene sheet (figure S2(e)).
2.2. Monovacancy formation from OH molecule with SW defect
Figure 3 shows the formation processes of two MVs derived from OH molecules on the graphene lattices. The two OH molecules are shown in figures 3(a)–(c). In figures 3(d)–(e), the upper OH molecule is constructed to form an MV (figure 3(f)), and a reconstructed MV (r-MV) is present at the lower OH molecule position. Indeed, an MV can represent a Jahn–Teller distortion, so the initial MV is reconstructed as a (5–9) defect. Therefore, r-MV is easily observed at the MV position. Electron beam irradiation removes the upper molecule and forms the MV in the same location; in contrast, r-MV is healed (figure 3(f)). figure 4 shows DFT calculation results that are in good agreement with the experimental results. In the case of the unstable structures in figures 4(b)–(f), the atomic positions were selected from the experimental TEM images by assigning carbon and oxygen atoms to the bright points in the images of figure 3.
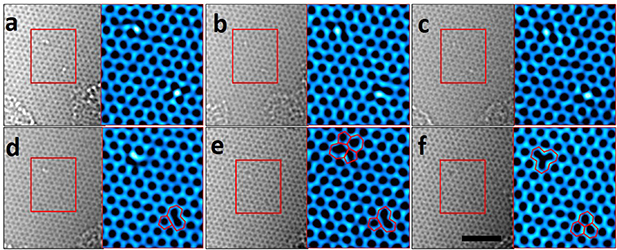
Figure 3. (a)–(c) ARTEM images showing two OH molecules on the graphene lattice. (d) TEM image showing the transformation from the lower molecule on the sheet into r-MV. (e) ARTEM image showing the formation of reconstructed to a (55–77) defect by SW transformation at the upper position. (f) Final state of this process is showing an MV and a lattice healing in the sheet. The colored TEM images are enlarged images of red boxes in figure 3. The scale bar is 2 nm.
Download figure:
Standard image High-resolution image
Figure 4. Atomic models of the MV formation along with energy barriers and formation energies for this process. (a) OH molecule on bridging of C–C bonds in graphene lattice. (b)–(f) Intermediate states of the MV formation process. SW transformations of carbon dimers indicated by yellow dashed boxes are involved in this process. (g) MV formed by the process. The blue values represent the energy barriers, while the dark gray bars represent the respective formation energies (eV).
Download figure:
Standard image High-resolution imageHere, the structural change of the position of the upper molecule in figure 3 is apparent through continuous electron beam irradiation. The OH molecules presented in figures 3(a)–(c) are converted to r-MV and the complete hexagonal lattice as show in figure 3(f). The atomic structures in figures 3(d) and (e) show the formation process of the MV. However, the recorded atomic structure does not match the known form of MV, therefore it is considered a superposition of several metastable intermediate structures.
We propose a pathway that forms the behaviors of figure 3. figure 4(a) shows the upper position of the molecule in figure 3. In order to match the experimental image with the calculated values as shown in figures 3(a)–(c), a bridging of C–C bonds was considered as the starting point of the path, but the OH molecule prefers to attach to a carbon atom in the graphene sheet as shown in figure 4(b). So, the OH molecule moves to a carbon atom with an energy barrier of 0.24 eV. The hexagonal lattice containing the OH molecule is transformed into a (55–77) defect by the Stone–Wales (SW) transformation of carbon dimers (dashed yellow box in figure 4(b)). The rotational barrier for this process was found to be 6.78 eV in DFT calculations. figures 4(c) and (d) show the dissociation of the OH molecule, and its energy barrier was found to be 3.26 eV. The energy barrier to break two C–C bonds (indicated by the two dashed yellow lines in figure 4(d)) was found to be 5.73 eV. Meanwhile, the energy barrier to simultaneously detach C–O atoms from a graphene lattice (indicated by the yellow 'X' in the side view of figure 4(e)) was found to be 6.76 eV. The structural change of the defect in figure 4(e) to an MV is made possible through 90° rotation (SW transformation) of the dimer indicated by the dashed yellow box in figure 4(f). The energy barrier for this process was calculated to be 1.55 eV. The site adsorbing the OH molecule is reconstructed as a (55–77) defect by the SW transformation (figures 4(a)–(c)). After detaching the C–O atoms at the same time (figures 4(e) and (f)), the defect is once again reconstructed into an MV by the SW transformation (figure 4(g)).
Figure S3 shows the MV formation process where hydrogen atom is not included in figure 3. The oxygen atom can move onto a carbon atom in the graphene lattice with energy transfer above 0.83 eV, but there are no additional activation barriers (figure S3(b)). This means that the movement of oxygen atoms on the graphene lattice can only be achieved without the reaction of special carbon atoms and oxygen atoms. Explaining the path in this next step, the hexagonal lattice containing the oxygen atom can be transformed to (55–77) defects by the SW transformation of the carbon dimers indicated by the dashed yellow box in figure S3(b). The rotational barrier for this process was found to be 5.20 eV in the DFT calculations. Figures S3(c) and (d) show the breaking of two C–C atoms (indicated by the two dashed yellow lines in figure 4(c)), and the energy barrier was found to be 5.73 eV. The energy barrier associated with the simultaneous detachment of C–O atoms from graphene lattice (indicated by the yellow 'X' in the side view of figure S3(d)) was found to be 6.76 eV. The structural change of the (55–77) defect to an MV becomes possible by the 90° rotation (SW transformation) of the dimer indicated by the dashed yellow box in figure S3(e). The energy barrier for this process was calculated to be 1.55 eV. The lattice was reconstructed into the (55–77) defect by the SW transformation (figures S3(a)–(c)). After detaching C–O atoms, the defect was reconstructed into an MV by the SW transformation (figure S3(f)). However, this entire process is unfavorable compared to the previous case (figure 4), which contained a hydrogen atom, because of the absence of hydrogen, it is impossible for the hydroxyl structure to remain stable [49, 51].
2.3. Divacancy formation from OH molecule on MV
The second type of defect is DV. A DV induced by OH molecules was analyzed. Generally, a DV is formed when there are no two neighboring carbon atoms. The lowest energy state this occurs is when they are in the same atomic layer. However, it is possible for an OH molecule to form a DV directly on an MV in a graphene lattice. Furthermore, on the basis of our experimental results (shown in figures 1–4), it is necessary to take into account the hydrogen atoms.
Figure 5 shows the formation of DV in a monolayer graphene sheet. figure 5(a) shows a TEM image that matches the DFT calculated atomic model in figure 5(d). Figures 5(b) and (c) show a DV, which is very unique and distinct from the MV. We propose a pathway for the formation of DV derived from OH molecules on MV in the graphene sheet. Starting from the initial MV with an OH molecule (figure 5(d)), OH molecule is initially divided into a hydrogen atom and an oxygen atom (figure 5(e)); this energy barrier was found to be 2.20 eV. The hydrogen atom moves to the carbon atom located in the zigzag direction along the yellow arrow in figure 5(e); this energy barrier was found to be 1.73 eV. By moving a carbon atom in the direction of the yellow arrow in figure 5(f) (with an energy barrier 2.95 eV), the MV is subsequently migrated further (figure 5(g)). After breaking the bonding between the C–O atoms and the carbon atom positioned in the zigzag direction (figure 5(h)), the MV in turn is reconfigured as a DV (figure 5(h)), and this energy barrier was found to 3.51 eV. When the C–O atoms are finally simultaneously detached (figure 5(i)), the DV is clearly shown. This detachment barrier was found to 7.05 eV. Due to the Jahn–Teller distortion, DV can be easily reconstructed with adjacent carbon atoms.
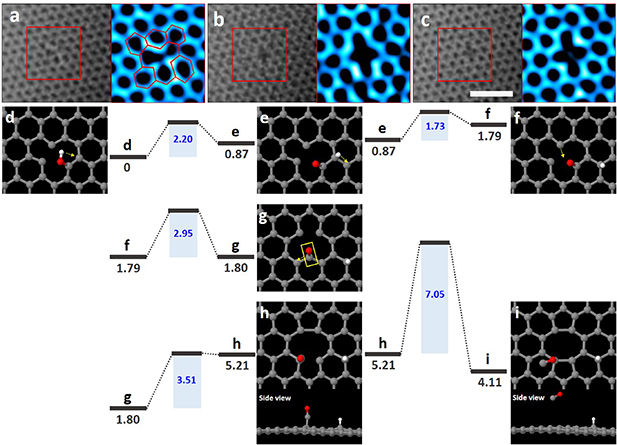
Figure 5. ARTEM images showing DV in monolayer graphene sheet. (a) The adsorption of an OH molecule on an MV. (b) and (c) Formation of DV. All colored TEM images each represent an enlarged image of the red box in figure 5. The scale bar is 1 nm. (d)–(i) Atomic models of the DV formation, along with energy barriers and formation energies for this process. (d) The OH molecule on MV in the graphene lattice. (e)–(g) Intermediate states of the DV formation process. (h) and (i) DV formed (reconstructed) by the process. Energy barriers (blue shadings) and formation energies (dark gray bars) of this process (eV).
Download figure:
Standard image High-resolution image2.4. The pair of 13–5 rings formation from OH molecule
The last type of defect is a pair of 13–5 rings (figure 6). This type is very similar to a nitrogen-mediated MV [46] or a saddle point [1] for the motion of the MV. The defect is derived from an OH molecule on the bridging of C–C bonds, such as an epoxide group with one co-adsorbed hydrogen atom, which has an intermediate state (figures 6(a) and (b)). As shown in figures 6(c) and (d), a new MV such as a pair of 13–5 rings is observed. This pair of 13–5 rings is stable for a few seconds. Indeed, the same structure, consisting of only a single carbon atom, is unstable because it is one of the migration paths that MV can move to adjacent atomic sites. However, if it contains hydrogen atoms, this can be stable under electron beam irradiation. The hydrogen atoms involved in the pair of 13–5 rings make it stable. In addition, participating atoms should also stabilize a higher-numbered vacancies and pentavacancies such as 13–5 ring pairs.

Figure 6. ARTEM images showing a pair of 13–5 rings in the monolayer graphene sheet. (a) OH molecule on the bridging of C–C bonds in the graphene lattice. (b) Intermediate state of this process. (c) and (d) The pair of 13–5 rings in the same position. All colored TEM images each represent an enlarged image of the red box in figure 6. The scale bar is 1 nm.
Download figure:
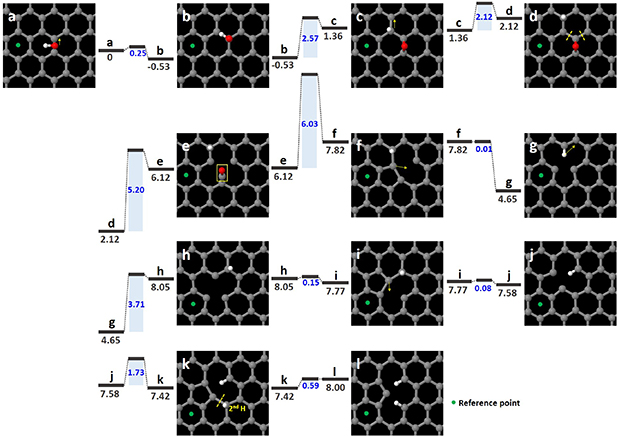
Standard image High-resolution imageFigure 7 shows how 13–5 pairs of rings are formed and stabilized with the structure shown in figure 6 through this process. Figures 7(a)–(l) suggest a pathway in which the detachment of C–O atoms involves the addition of a second hydrogen atom to form the observed structure. The OH molecule moves to a carbon atom located in the direction of the yellow arrow in Figures 7(a) and b, with an energy barrier of 0.25 eV. The OH molecule dissociates into a hydrogen atom and an oxygen atom (Figure 7(c)). Figure 7(d) shows that the hydrogen atom then binds to a carbon atom located in the direction of the yellow arrow in Figure 7(c). These energy barriers were found to be 2.57 and 2.12 eV, respectively. The energy barrier associated with the destruction of the two C–C bonds (indicated by the two dashed yellow lines in Figure 7(d)) was found to be 5.20 eV, and the energy barrier associated with simultaneously detaching the C–O atoms (indicated by the yellow box in the figure) was found to be 6.03 eV. After detachment of the C–O atoms, an r-MV is formed by the Jahn–Teller distortion with energy barrier of 0.01 eV (Figure 7(f)). Furthermore, the hydrogen atom moves to the carbon atom in the direction of the yellow arrow in Figure 7(f), as shown in Figure 7(h). The MV, which indicates an r-MV in Figure 7(i), is displaced by moving a carbon atom in the direction of the yellow arrow in Figure 7(i) (Figure 7(j)), and this energy barrier was found to be 0.08 eV. By adding a second hydrogen atom in Figure 7(k), an r-MV maintains the MV structure. However, this energy barrier increases to 1.73 eV. The final structure is formed after the C–C bond is broken as indicated by the dashed yellow line in Figure 7(k).
Figure 7. Atomic models of the new MV formation along with energy barriers and formation energies for this process. (a) OH molecule on the bridging of C–C bonds in the graphene lattice. (b)–(k) Intermediate states of the new MV formation process. Energy barriers (blue shadings) and formation energies (dark gray bars) of this process (eV).
Download figure:
Standard image High-resolution image
Here we emphasize that in all of the above observations, the point defect is the result of the combination of an oxidation process and the electron beam irradiation on the surface adsorbing oxygen and hydrogen atoms. Most of all, we suggest direct TEM images showing the formation of point defects at the same position where oxygen atoms are attached and these defects definitely were formed by the mediation of oxygen and hydrogen atoms. Also, since the behavior of atoms occurring in the interval time acquiring between successive TEM images cannot be confirmed with images, we have proposed the most reasonable path for this part using DFT calculation. These results show the practical effects of oxygen and hydrogen atoms on the formation of point defects and suggest that the presence of hydrogen atoms not only lowers the energy barrier required for MV formation but also stabilizes the structure of point defects. So, these defects were stable at least for the typical time required to record an image sequence, i.e. several seconds. The same type of defect was found in other studies under electron beam and ion irradiation [14–17], but our investigation suggests the different formation mechanisms of the defects by the oxygen and hydrogen atoms. And, all the results suggest that hydrogen atoms were present in the TEM.
3. Conclusion
In this paper, we described our observations with ARTEM showing the formation of various point defects involving OH molecules in monolayer graphene sheets. It included images showing the atomic structures of MVs, DVs, and a pair of 13–5 rings. We show that an oxygen-containing functional group deliberately adsorbed to a graphene surface allows the formation of point defects under electron beam irradiation, and stabilizes the pair of 13–5 rings. Unlike previous reports, our observations show that the simultaneous detachment process of C–O atoms from graphene surface actually has intermediate states in the formation of point defects. In addition, hydrogen atom contains a pair of 13–5 ring structure to stabilize the defect. These intermediate atoms can readily recombine with adjacent carbon atoms due to their low net energy requirements; therefore, these atoms were often defect reconstruction sites, and the results were reinforced by DFT calculations. The images and analyses demonstrated that the oxygen and hydrogen atoms bound to carbon atoms on the graphene surface as functional groups induce vacancies in intermediate states and that they stabilized a pair of 13–5 rings.
4. Methods
4.1. Synthesis and transfer of monolayer graphene sheet
Monolayer graphene sheets were synthesized by chemical vapor deposition on 25 μm-thick copper foil (99.8% Alfa Aesar, 13382). First, the 25 μm-thick copper foil (99.8% Alfa Aesar, 13382) was washed with HCl/H2O (1:10), rinsed with acetone and alcohol, and dried in ambient air. The dried copper foil was then inserted into a quartz tube and heated to 1000 °C with 2 sccm H2 flowing at 10 mTorr. After annealing for 1 h, a gas mixture of 10 sccm CH4 and 2 sccm H2 was introduced at 100 mTorr for 25 min to synthesize graphene. Thereafter, a fast cool to room temperature with flowing 10 sccm CH4 and 2 sccm H2 was performed [47]. Finally, the synthesized sheet was transferred onto TEM grids by using direct transfer [52].
4.2. ARTEM observations
Specimens were analyzed using an aberration-corrected FEI Titan Cubed TEM (FEI Titan 3 G2 60-300), which was operated at an 80 kV acceleration voltage with a monochromator. The microscope provided a sub-Angstrom resolution at 80 kV and −13 ± 0.5 μm of spherical aberration (Cs). Typical electron beam densities were adjusted to ∼6 × 10⁵ e− nm−2. The atomic images were taken using a white atom contrast to obtain the actual atom positions under the properly focused conditions needed for direct image interpretation.
4.3. Image processing
ImageJ was used to process the magnified TEM images.
4.4. Image simulation
ARTEM image simulations were performed using MacTempasX with our experimental TEM imaging conditions.
4.5. DFT calculations
All the DFT calculations were carried out using Vienna ab initio simulation package (VASP) code [53, 54]. The calculations were performed within the generalized gradient approximation of the Perdew–Burke–Ernzerhof functional [55] and the basis set contains plane waves up to an energy cutoff of 400 eV. We also checked spin-polarized calculations does not give different results. The 3 × 3 (18 atoms) hexagonal and 128 carbon atoms contained orthorhombic graphene supercell structure were used and the Brillouin zone was sampled using a 3 × 3 × 1 and 2 × 2 × 1 Monkhorst–Pack meshes [56], correspondingly. Structure relaxation was performed until the Hellman–Feynman force on each atom is smaller than 0.02 eV Å−1. To obtain energy barrier of each steps, we used the climbing-image nudged elastic band method [57] under the force tolerance of 0.02 eV Å−1. More precise transition-state search algorithm than the NEB method was used to find an accurate energy barrier [58, 59]. This method was optimized to find the highest saddle point among the various states near the transition-state along the reaction path.
4.6. UVO and oxygen plasma treatments
UVO treatments were performed using UV Ozone cleaner UVC-30 (Jaesung Engineering Co.). The synthesized graphene sheet transferred on TEM grid was positioned center of the chamber.
Acknowledgments
This work was supported by the National Research Foundation of Korea (NRF) Grant funded by the Korea government (MSIT) (No. 2020R1G1A1099542 and No. 2018R1A2A2A05019598). This work was supported by IBS-R019-D1. G-D L and S L acknowledge support from the Supercomputing Center/Korea Institute of Science and Technology Information with supercomputing resources (KSC-2018-G2-0003) and from the National Research Foundation of Korea (NRF) Grant (RIAM 2019R1A2C2005098, RIAM 2019R1A6A3A01091287).
Author contributions
The manuscript was written through contributions of all authors. All authors have given approval to the final version of the manuscript.